


浏览 1.5k
效果展示:
Screenshots
Nginx virtual host traffic status module

Nginx virtual host traffic status module
Table of Contents
- Version
- Dependencies
- Compatibility
- Screenshots
- Installation
- Synopsis
- Description
- Calculations and Intervals
- Control
- Set
- JSON
- Variables
- Limit
- Use cases
- To calculate traffic for individual country using GeoIP
- To calculate traffic for individual storage volume
- To calculate traffic for individual user agent
- To calculate traffic for detailed http status code
- To calculate traffic for dynamic dns
- To calculate traffic except for status page
- Customizing
- Directives
- vhost_traffic_status
- vhost_traffic_status_zone
- vhost_traffic_status_dump
- vhost_traffic_status_display
- vhost_traffic_status_display_format
- vhost_traffic_status_display_jsonp
- vhost_traffic_status_display_sum_key
- vhost_traffic_status_filter
- vhost_traffic_status_filter_by_host
- vhost_traffic_status_filter_by_set_key
- vhost_traffic_status_filter_check_duplicate
- vhost_traffic_status_filter_max_node
- vhost_traffic_status_limit
- vhost_traffic_status_limit_traffic
- vhost_traffic_status_limit_traffic_by_set_key
- vhost_traffic_status_limit_check_duplicate
- vhost_traffic_status_set_by_filter
- vhost_traffic_status_average_method
- vhost_traffic_status_histogram_buckets
- vhost_traffic_status_bypass_limit
- vhost_traffic_status_bypass_stats
- See Also
- TODO
- Donation
- Author
Version
This document describes nginx-module-vts v0.1.18 released on 22 Jun 2018.
This document describes nginx-module-vts v0.1.18 released on 22 Jun 2018.
Dependencies
Compatibility
- Nginx
- 1.15.x (last tested: 1.15.0)
- 1.14.x (last tested: 1.14.0)
- 1.13.x (last tested: 1.13.12)
- 1.12.x (last tested: 1.12.2)
- 1.11.x (last tested: 1.11.10)
- 1.10.x (last tested: 1.10.3)
- 1.8.x (last tested: 1.8.0)
- 1.6.x (last tested: 1.6.3)
- 1.4.x (last tested: 1.4.7)
Earlier versions is not tested.
Screenshots


Installation
- Clone the git repository.
shell> git clone git://github.com/vozlt/nginx-module-vts.git
Add the module to the build configuration by adding --add-module=/path/to/nginx-module-vts
Build the nginx binary.
Install the nginx binary.
- Clone the git repository.
shell> git clone git://github.com/vozlt/nginx-module-vts.git
Add the module to the build configuration by adding
--add-module=/path/to/nginx-module-vtsBuild the nginx binary.
Install the nginx binary.
Synopsis
http {
    vhost_traffic_status_zone;

    ...

    server {

        ...

        location /status {
            vhost_traffic_status_display;
            vhost_traffic_status_display_format html;
        }
    }
}
http { vhost_traffic_status_zone; ... server { ... location /status { vhost_traffic_status_display; vhost_traffic_status_display_format html; } } }
Description
This is an Nginx module that provides access to virtual host status information. It contains the current status such as servers, upstreams, caches. This is similar to the live activity monitoring of nginx plus. The built-in html is also taken from the demo page of old version.
First of all, the directive vhost_traffic_status_zone is required, and then if the directive vhost_traffic_status_display is set, can be access to as follows:
- /status/format/json
- If you request
/status/format/json, will respond with a JSON document containing the current activity data for using in live dashboards and third-party monitoring tools.
- /status/format/html
- If you request
/status/format/html, will respond with the built-in live dashboard in HTML that requests internally to /status/format/json.
- /status/format/jsonp
- If you request
/status/format/jsonp, will respond with a JSONP callback function containing the current activity data for using in live dashboards and third-party monitoring tools.
- /status/format/prometheus
- If you request
/status/format/prometheus, will respond with a prometheus document containing the current activity data.
- /status/control
- If you request
/status/control, will respond with a JSON document after it reset or delete zones through a query string. See the Control.
JSON document contains as follows:
{
    "hostName": ...,
    "nginxVersion": ...,
    "loadMsec": ...,
    "nowMsec": ...,
    "connections": {
        "active":...,
        "reading":...,
        "writing":...,
        "waiting":...,
        "accepted":...,
        "handled":...,
        "requests":...
    },
    "sharedZones": {
        "name":...,
        "maxSize":...,
        "usedSize":...,
        "usedNode":...
    },
    "serverZones": {
        "...":{
            "requestCounter":...,
            "inBytes":...,
            "outBytes":...,
            "responses":{
                "1xx":...,
                "2xx":...,
                "3xx":...,
                "4xx":...,
                "5xx":...,
                "miss":...,
                "bypass":...,
                "expired":...,
                "stale":...,
                "updating":...,
                "revalidated":...,
                "hit":...,
                "scarce":...
            },
            "requestMsecCounter":...,
            "requestMsec":...,
            "requestMsecs":{
                "times":[...],
                "msecs":[...]
            },
            "requestBuckets":{
                "msecs":[...],
                "counters":[...]
            },
        }
        ...
    },
    "filterZones": {
        "...":{
            "...":{
                "requestCounter":...,
                "inBytes":...,
                "outBytes":...,
                "responses":{
                    "1xx":...,
                    "2xx":...,
                    "3xx":...,
                    "4xx":...,
                    "5xx":...,
                    "miss":...,
                    "bypass":...,
                    "expired":...,
                    "stale":...,
                    "updating":...,
                    "revalidated":...,
                    "hit":...,
                    "scarce":...
                },
                "requestMsecCounter":...,
                "requestMsec":...,
                "requestMsecs":{
                    "times":[...],
                    "msecs":[...]
                },
                "requestBuckets":{
                    "msecs":[...],
                    "counters":[...]
                },
            },
            ...
        },
        ...
    },
    "upstreamZones": {
        "...":[
            {
                "server":...,
                "requestCounter":...,
                "inBytes":...,
                "outBytes":...,
                "responses":{
                    "1xx":...,
                    "2xx":...,
                    "3xx":...,
                    "4xx":...,
                    "5xx":...
                },
                "requestMsecCounter":...,
                "requestMsec":...,
                "requestMsecs":{
                    "times":[...],
                    "msecs":[...]
                },
                "requestBuckets":{
                    "msecs":[...],
                    "counters":[...]
                },
                "responseMsecCounter":...,
                "responseMsec":...,
                "responseMsecs":{
                    "times":[...],
                    "msecs":[...]
                },
                "responseBuckets":{
                    "msecs":[...],
                    "counters":[...]
                },
                "weight":...,
                "maxFails":...,
                "failTimeout":...,
                "backup":...,
                "down":...
            }
            ...
        ],
        ...
    }
    "cacheZones": {
        "...":{
            "maxSize":...,
            "usedSize":...,
            "inBytes":...,
            "outBytes":...,
            "responses":{
                "miss":...,
                "bypass":...,
                "expired":...,
                "stale":...,
                "updating":...,
                "revalidated":...,
                "hit":...,
                "scarce":...
            }
        },
        ...
    }
}- main
- Basic version, uptime((nowMsec - loadMsec)/1000)
- nowMsec, loadMsec is a millisecond.
- connections
- Total connections and requests(same as stub_status_module in NGINX)
- sharedZones
- The shared memory information using in nginx-module-vts.
- serverZones
- Traffic(in/out) and request and response counts and cache hit ratio per each server zone
- Total traffic(In/Out) and request and response counts(It zone name is
*) and hit ratio
- filterZones
- Traffic(in/out) and request and response counts and cache hit ratio per each server zone filtered through the
vhost_traffic_status_filter_by_set_key directive - Total traffic(In/Out) and request and response counts(It zone name is
*) and hit ratio filtered through the vhost_traffic_status_filter_by_set_key directive
- upstreamZones
- Traffic(in/out) and request and response counts per server in each upstream group
- Current settings(weight, maxfails, failtimeout...) in nginx.conf
- cacheZones
- Traffic(in/out) and size(capacity/used) and hit ratio per each cache zone when using the proxy_cache directive.
The overCounts objects in JSON document are mostly for 32bit system and will be increment by 1 if its value is overflowed. The directive vhost_traffic_status_display_format sets the default ouput format that is one of json, jsonp, html, prometheus. (Default: json)
Traffic calculation as follows:
- ServerZones
- in += requested_bytes
- out += sent_bytes
- FilterZones
- in += requested_bytes via the filter
- out += sent_bytes via the filter
- UpstreamZones
- in += requested_bytes via the ServerZones
- out += sent_bytes via the ServerZones
- cacheZones
- in += requested_bytes via the ServerZones
- out += sent_bytes via the ServerZones
All calculations are working in log processing phase of Nginx. Internal redirects(X-Accel-Redirect or error_page) does not calculate in the UpstreamZones.
Caveats: this module relies on nginx logging system(NGX_HTTP_LOG_PHASE:last phase of the nginx http), so the traffic may be in certain cirumstances different that real bandwidth traffic. Websocket, canceled downloads may be cause of inaccuracies. The working of the module doesn't matter at all whether the access_log directive "on" or "off". Again, this module works well on "access_log off". When using several domains it sets to be first domain(left) of server_name directive. If you don't want it, see the vhost_traffic_status_filter_by_host, vhost_traffic_status_filter_by_set_key directive.
See the following modules for the stream traffic statistics:
This is an Nginx module that provides access to virtual host status information. It contains the current status such as servers, upstreams, caches. This is similar to the live activity monitoring of nginx plus. The built-in html is also taken from the demo page of old version.
First of all, the directive vhost_traffic_status_zone is required, and then if the directive vhost_traffic_status_display is set, can be access to as follows:
- /status/format/json
- If you request
/status/format/json, will respond with a JSON document containing the current activity data for using in live dashboards and third-party monitoring tools.
- If you request
- /status/format/html
- If you request
/status/format/html, will respond with the built-in live dashboard in HTML that requests internally to/status/format/json.
- If you request
- /status/format/jsonp
- If you request
/status/format/jsonp, will respond with a JSONP callback function containing the current activity data for using in live dashboards and third-party monitoring tools.
- If you request
- /status/format/prometheus
- If you request
/status/format/prometheus, will respond with a prometheus document containing the current activity data.
- If you request
- /status/control
- If you request
/status/control, will respond with a JSON document after it reset or delete zones through a query string. See the Control.
- If you request
JSON document contains as follows:
{
"hostName": ...,
"nginxVersion": ...,
"loadMsec": ...,
"nowMsec": ...,
"connections": {
"active":...,
"reading":...,
"writing":...,
"waiting":...,
"accepted":...,
"handled":...,
"requests":...
},
"sharedZones": {
"name":...,
"maxSize":...,
"usedSize":...,
"usedNode":...
},
"serverZones": {
"...":{
"requestCounter":...,
"inBytes":...,
"outBytes":...,
"responses":{
"1xx":...,
"2xx":...,
"3xx":...,
"4xx":...,
"5xx":...,
"miss":...,
"bypass":...,
"expired":...,
"stale":...,
"updating":...,
"revalidated":...,
"hit":...,
"scarce":...
},
"requestMsecCounter":...,
"requestMsec":...,
"requestMsecs":{
"times":[...],
"msecs":[...]
},
"requestBuckets":{
"msecs":[...],
"counters":[...]
},
}
...
},
"filterZones": {
"...":{
"...":{
"requestCounter":...,
"inBytes":...,
"outBytes":...,
"responses":{
"1xx":...,
"2xx":...,
"3xx":...,
"4xx":...,
"5xx":...,
"miss":...,
"bypass":...,
"expired":...,
"stale":...,
"updating":...,
"revalidated":...,
"hit":...,
"scarce":...
},
"requestMsecCounter":...,
"requestMsec":...,
"requestMsecs":{
"times":[...],
"msecs":[...]
},
"requestBuckets":{
"msecs":[...],
"counters":[...]
},
},
...
},
...
},
"upstreamZones": {
"...":[
{
"server":...,
"requestCounter":...,
"inBytes":...,
"outBytes":...,
"responses":{
"1xx":...,
"2xx":...,
"3xx":...,
"4xx":...,
"5xx":...
},
"requestMsecCounter":...,
"requestMsec":...,
"requestMsecs":{
"times":[...],
"msecs":[...]
},
"requestBuckets":{
"msecs":[...],
"counters":[...]
},
"responseMsecCounter":...,
"responseMsec":...,
"responseMsecs":{
"times":[...],
"msecs":[...]
},
"responseBuckets":{
"msecs":[...],
"counters":[...]
},
"weight":...,
"maxFails":...,
"failTimeout":...,
"backup":...,
"down":...
}
...
],
...
}
"cacheZones": {
"...":{
"maxSize":...,
"usedSize":...,
"inBytes":...,
"outBytes":...,
"responses":{
"miss":...,
"bypass":...,
"expired":...,
"stale":...,
"updating":...,
"revalidated":...,
"hit":...,
"scarce":...
}
},
...
}
}- main
- Basic version, uptime((nowMsec - loadMsec)/1000)
- nowMsec, loadMsec is a millisecond.
- connections
- Total connections and requests(same as stub_status_module in NGINX)
- sharedZones
- The shared memory information using in nginx-module-vts.
- serverZones
- Traffic(in/out) and request and response counts and cache hit ratio per each server zone
- Total traffic(In/Out) and request and response counts(It zone name is
*) and hit ratio
- filterZones
- Traffic(in/out) and request and response counts and cache hit ratio per each server zone filtered through the
vhost_traffic_status_filter_by_set_keydirective - Total traffic(In/Out) and request and response counts(It zone name is
*) and hit ratio filtered through thevhost_traffic_status_filter_by_set_keydirective
- Traffic(in/out) and request and response counts and cache hit ratio per each server zone filtered through the
- upstreamZones
- Traffic(in/out) and request and response counts per server in each upstream group
- Current settings(weight, maxfails, failtimeout...) in nginx.conf
- cacheZones
- Traffic(in/out) and size(capacity/used) and hit ratio per each cache zone when using the proxy_cache directive.
The overCounts objects in JSON document are mostly for 32bit system and will be increment by 1 if its value is overflowed. The directive vhost_traffic_status_display_format sets the default ouput format that is one of json, jsonp, html, prometheus. (Default: json)
Traffic calculation as follows:
- ServerZones
- in += requested_bytes
- out += sent_bytes
- FilterZones
- in += requested_bytes via the filter
- out += sent_bytes via the filter
- UpstreamZones
- in += requested_bytes via the ServerZones
- out += sent_bytes via the ServerZones
- cacheZones
- in += requested_bytes via the ServerZones
- out += sent_bytes via the ServerZones
All calculations are working in log processing phase of Nginx. Internal redirects(X-Accel-Redirect or error_page) does not calculate in the UpstreamZones.
Caveats: this module relies on nginx logging system(NGX_HTTP_LOG_PHASE:last phase of the nginx http), so the traffic may be in certain cirumstances different that real bandwidth traffic. Websocket, canceled downloads may be cause of inaccuracies. The working of the module doesn't matter at all whether the access_log directive "on" or "off". Again, this module works well on "access_log off". When using several domains it sets to be first domain(left) of server_name directive. If you don't want it, see the vhost_traffic_status_filter_by_host, vhost_traffic_status_filter_by_set_key directive.
See the following modules for the stream traffic statistics:
Calculations and Intervals
Averages
Control
It is able to reset or delete traffic zones through a query string. The request responds with a JSON document.
- URI Syntax
- /
{status_uri}/control?cmd={command}&group={group}&zone={name}
http {

    geoip_country /usr/share/GeoIP/GeoIP.dat;

    vhost_traffic_status_zone;
    vhost_traffic_status_filter_by_set_key $geoip_country_code country::*;

    ...

    server {

        server_name example.org;

        ...

        vhost_traffic_status_filter_by_set_key $geoip_country_code country::$server_name;

        location /status {
            vhost_traffic_status_display;
            vhost_traffic_status_display_format html;
        }
    }
}
If it set as above, then the control uri is like example.org/status/control.
The available request arguments are as follows:
- cmd=<
status|reset|delete>- status
- It returns status of traffic zones to json format like
status/format/json.
- reset
- It reset traffic zones without deleting nodes in shared memory.(= init to 0)
- delete
- It delete traffic zones in shared memory. when re-request recreated.
- group=<
server|filter|upstream@alone|upstream@group|cache|*>- server
- filter
- upstream@alone
- upstream@group
- cache
- *
- zone=name
- server
- name
- filter
- filter_group@name
- upstream@group
- upstream_group@name
- upstream@alone
- @name
- cache
- name
It is able to reset or delete traffic zones through a query string. The request responds with a JSON document.
- URI Syntax
- /
{status_uri}/control?cmd={command}&group={group}&zone={name}
- /
http { geoip_country /usr/share/GeoIP/GeoIP.dat; vhost_traffic_status_zone; vhost_traffic_status_filter_by_set_key $geoip_country_code country::*; ... server { server_name example.org; ... vhost_traffic_status_filter_by_set_key $geoip_country_code country::$server_name; location /status { vhost_traffic_status_display; vhost_traffic_status_display_format html; } } }
If it set as above, then the control uri is like example.org/status/control.
The available request arguments are as follows:
- cmd=<
status|reset|delete>- status
- It returns status of traffic zones to json format like
status/format/json.
- It returns status of traffic zones to json format like
- reset
- It reset traffic zones without deleting nodes in shared memory.(= init to 0)
- delete
- It delete traffic zones in shared memory. when re-request recreated.
- status
- group=<
server|filter|upstream@alone|upstream@group|cache|*>- server
- filter
- upstream@alone
- upstream@group
- cache
- *
- zone=name
- server
- name
- filter
- filter_group@name
- upstream@group
- upstream_group@name
- upstream@alone
- @name
- cache
- name
- server
To get status of traffic zones on the fly
This is similar to the status/format/json except that it can get each zones.
This is similar to the status/format/json except that it can get each zones.
To get fully zones
- It is exactly the same with the
status/format/json.- /status/control?cmd=status&group=*
- It is exactly the same with the
status/format/json.- /status/control?cmd=status&group=*
To get group zones
- mainZones
- /status/control?cmd=status&group=server&zone=::main
- serverZones
- /status/control?cmd=status&group=server&zone=*
- filterZones
- /status/control?cmd=status&group=filter&zone=*
- upstreamZones
- /status/control?cmd=status&group=upstream@group&zone=*
- upstreamZones::nogroups
- /status/control?cmd=status&group=upstream@alone&zone=*
- cacheZones
- /status/control?cmd=status&group=cache&zone=*
The mainZones values are default status values including hostName, nginxVersion, loadMsec, nowMsec, connections.
To get each zones
- single zone in serverZones
- /status/control?cmd=status&group=server&zone=
name
- single zone in filterZones
- /status/control?cmd=status&group=filter&zone=
filter_group@name
- single zone in upstreamZones
- /status/control?cmd=status&group=upstream@group&zone=
upstream_group@name
- single zone in upstreamZones::nogroups
- /status/control?cmd=status&group=upstream@alone&zone=
name
- single zone in cacheZones
- /status/control?cmd=status&group=cache&zone=
name
- single zone in serverZones
- /status/control?cmd=status&group=server&zone=
name
- /status/control?cmd=status&group=server&zone=
- single zone in filterZones
- /status/control?cmd=status&group=filter&zone=
filter_group@name
- /status/control?cmd=status&group=filter&zone=
- single zone in upstreamZones
- /status/control?cmd=status&group=upstream@group&zone=
upstream_group@name
- /status/control?cmd=status&group=upstream@group&zone=
- single zone in upstreamZones::nogroups
- /status/control?cmd=status&group=upstream@alone&zone=
name
- /status/control?cmd=status&group=upstream@alone&zone=
- single zone in cacheZones
- /status/control?cmd=status&group=cache&zone=
name
- /status/control?cmd=status&group=cache&zone=
To reset traffic zones on the fly
It reset the values of specified zones to 0.
It reset the values of specified zones to 0.
To reset fully zones
- /status/control?cmd=reset&group=*
- /status/control?cmd=reset&group=*
To reset group zones
- serverZones
- /status/control?cmd=reset&group=server&zone=*
- filterZones
- /status/control?cmd=reset&group=filter&zone=*
- upstreamZones
- /status/control?cmd=reset&group=upstream@group&zone=*
- upstreamZones::nogroups
- /status/control?cmd=reset&group=upstream@alone&zone=*
- cacheZones
- /status/control?cmd=reset&group=cache&zone=*
To reset each zones
- single zone in serverZones
- /status/control?cmd=reset&group=server&zone=
name
- single zone in filterZones
- /status/control?cmd=reset&group=filter&zone=
filter_group@name
- single zone in upstreamZones
- /status/control?cmd=reset&group=upstream@group&zone=
upstream_group@name
- single zone in upstreamZones::nogroups
- /status/control?cmd=reset&group=upstream@alone&zone=
name
- single zone in cacheZones
- /status/control?cmd=reset&group=cache&zone=
name
- single zone in serverZones
- /status/control?cmd=reset&group=server&zone=
name
- /status/control?cmd=reset&group=server&zone=
- single zone in filterZones
- /status/control?cmd=reset&group=filter&zone=
filter_group@name
- /status/control?cmd=reset&group=filter&zone=
- single zone in upstreamZones
- /status/control?cmd=reset&group=upstream@group&zone=
upstream_group@name
- /status/control?cmd=reset&group=upstream@group&zone=
- single zone in upstreamZones::nogroups
- /status/control?cmd=reset&group=upstream@alone&zone=
name
- /status/control?cmd=reset&group=upstream@alone&zone=
- single zone in cacheZones
- /status/control?cmd=reset&group=cache&zone=
name
- /status/control?cmd=reset&group=cache&zone=
To delete traffic zones on the fly
It delete the specified zones in shared memory.
It delete the specified zones in shared memory.
To delete fully zones
- /status/control?cmd=delete&group=*
- /status/control?cmd=delete&group=*
To delete group zones
- serverZones
- /status/control?cmd=delete&group=server&zone=*
- filterZones
- /status/control?cmd=delete&group=filter&zone=*
- upstreamZones
- /status/control?cmd=delete&group=upstream@group&zone=*
- upstreamZones::nogroups
- /status/control?cmd=delete&group=upstream@alone&zone=*
- cacheZones
- /status/control?cmd=delete&group=cache&zone=*
To delete each zones
- single zone in serverZones
- /status/control?cmd=delete&group=server&zone=
name
- single zone in filterZones
- /status/control?cmd=delete&group=filter&zone=
filter_group@name
- single zone in upstreamZones
- /status/control?cmd=delete&group=upstream@group&zone=
upstream_group@name
- single zone in upstreamZones::nogroups
- /status/control?cmd=delete&group=upstream@alone&zone=
name
- single zone in cacheZones
- /status/control?cmd=delete&group=cache&zone=
name
- single zone in serverZones
- /status/control?cmd=delete&group=server&zone=
name
- /status/control?cmd=delete&group=server&zone=
- single zone in filterZones
- /status/control?cmd=delete&group=filter&zone=
filter_group@name
- /status/control?cmd=delete&group=filter&zone=
- single zone in upstreamZones
- /status/control?cmd=delete&group=upstream@group&zone=
upstream_group@name
- /status/control?cmd=delete&group=upstream@group&zone=
- single zone in upstreamZones::nogroups
- /status/control?cmd=delete&group=upstream@alone&zone=
name
- /status/control?cmd=delete&group=upstream@alone&zone=
- single zone in cacheZones
- /status/control?cmd=delete&group=cache&zone=
name
- /status/control?cmd=delete&group=cache&zone=
Set
It can get the status values in nginx configuration separately using vhost_traffic_status_set_by_filter directive. It can acquire almost all status values and the obtained value is stored in user-defined-variable which is first argument.
- Directive Syntax
- vhost_traffic_status_set_by_filter $variable group/zone/name
http {

    geoip_country /usr/share/GeoIP/GeoIP.dat;

    vhost_traffic_status_zone;
    vhost_traffic_status_filter_by_set_key $geoip_country_code country::*;

    ...
    upstream backend {
        10.10.10.11:80;
        10.10.10.12:80;
    }

    server {

        server_name example.org;

        ...

        vhost_traffic_status_filter_by_set_key $geoip_country_code country::$server_name;

        vhost_traffic_status_set_by_filter $requestCounter server/example.org/requestCounter;
        vhost_traffic_status_set_by_filter $requestCounterKR filter/country::example.org@KR/requestCounter;

        location /backend {
            vhost_traffic_status_set_by_filter $requestCounterB1 upstream@group/backend@10.10.10.11:80/requestCounter;
            proxy_pass http://backend;
        }
    }
}
The above settings are as follows:
- $requestCounter
- serverZones -> example.org -> requestCounter
- $requestCounterKR
- filterZones -> country::example.org -> KR -> requestCounter
- $requestCounterB1
- upstreamZones -> backend -> 10.0.10.11:80 -> requestCounter
Please see the vhost_traffic_status_set_by_filter directive for detailed usage.
It can get the status values in nginx configuration separately using vhost_traffic_status_set_by_filter directive. It can acquire almost all status values and the obtained value is stored in user-defined-variable which is first argument.
- Directive Syntax
- vhost_traffic_status_set_by_filter $variable group/zone/name
http { geoip_country /usr/share/GeoIP/GeoIP.dat; vhost_traffic_status_zone; vhost_traffic_status_filter_by_set_key $geoip_country_code country::*; ... upstream backend { 10.10.10.11:80; 10.10.10.12:80; } server { server_name example.org; ... vhost_traffic_status_filter_by_set_key $geoip_country_code country::$server_name; vhost_traffic_status_set_by_filter $requestCounter server/example.org/requestCounter; vhost_traffic_status_set_by_filter $requestCounterKR filter/country::example.org@KR/requestCounter; location /backend { vhost_traffic_status_set_by_filter $requestCounterB1 upstream@group/backend@10.10.10.11:80/requestCounter; proxy_pass http://backend; } } }
The above settings are as follows:
- $requestCounter
- serverZones -> example.org -> requestCounter
- $requestCounterKR
- filterZones -> country::example.org -> KR -> requestCounter
- $requestCounterB1
- upstreamZones -> backend -> 10.0.10.11:80 -> requestCounter
Please see the vhost_traffic_status_set_by_filter directive for detailed usage.
JSON
The following status information is provided in the JSON format:
The following status information is provided in the JSON format:
Json used by status
/{status_uri}/format/json
/{status_uri}/control?cmd=status&...
- hostName
- Host name.
- nginxVersion
- Version of the provided.
- loadMsec
- Loaded process time in milliseconds.
- nowMsec
- Current time in milliseconds
- connections
- active
- The current number of active client connections.
- reading
- The total number of reading client connections.
- writing
- The total number of writing client connections.
- waiting
- The total number of wating client connections.
- accepted
- The total number of accepted client connections.
- handled
- The total number of handled client connections.
- requests
- The total number of requested client connections.
- sharedZones
- name
- The name of shared memory specified in the configuration.(default:
vhost_traffic_status)
- maxSize
- The limit on the maximum size of the shared memory specified in the configuration.
- usedSize
- The current size of the shared memory.
- usedNode
- The current number of node using in shared memory. It can get an approximate size for one node with the following formula: (usedSize / usedNode)
- serverZones
- requestCounter
- The total number of client requests received from clients.
- inBytes
- The total number of bytes received from clients.
- outBytes
- The total number of bytes sent to clients.
- responses
- 1xx, 2xx, 3xx, 4xx, 5xx
- The number of responses with status codes 1xx, 2xx, 3xx, 4xx, and 5xx.
- miss
- The number of cache miss.
- bypass
- The number of cache bypass.
- expired
- The number of cache expired.
- stale
- The number of cache stale.
- updating
- The number of cache updating.
- revalidated
- The number of cache revalidated.
- hit
- The number of cache hit.
- scarce
- The number of cache scare.
- requestMsecCounter
- The number of accumulated request processing time in milliseconds.
- requestMsec
- The average of request processing times in milliseconds.
- requestMsecs
- times
- The times in milliseconds at request processing times.
- msecs
- The request processing times in milliseconds.
- requestBuckets
- msecs
- The bucket values of histogram set by
vhost_traffic_status_histogram_buckets directive.
- counters
- The cumulative values for the reason that each bucket value is greater than or equal to the request processing time.
- filterZones
- It provides the same fields with
serverZones except that it included group names.
- upstreamZones
- server
- An address of the server.
- requestCounter
- The total number of client connections forwarded to this server.
- inBytes
- The total number of bytes received from this server.
- outBytes
- The total number of bytes sent to this server.
- responses
- 1xx, 2xx, 3xx, 4xx, 5xx
- The number of responses with status codes 1xx, 2xx, 3xx, 4xx, and 5xx.
- requestMsecCounter
- The number of accumulated request processing time including upstream in milliseconds.
- requestMsec
- The average of request processing times including upstream in milliseconds.
- requestMsecs
- times
- The times in milliseconds at request processing times.
- msecs
- The request processing times including upstream in milliseconds.
- requestBuckets
- msecs
- The bucket values of histogram set by
vhost_traffic_status_histogram_buckets directive.
- counters
- The cumulative values for the reason that each bucket value is greater than or equal to the request processing time including upstream.
- responseMsecCounter
- The number of accumulated only upstream response processing time in milliseconds.
- responseMsec
- The average of only upstream response processing times in milliseconds.
- responseMsecs
- times
- The times in milliseconds at request processing times.
- msecs
- The only upstream response processing times in milliseconds.
- responseBuckets
- msecs
- The bucket values of histogram set by
vhost_traffic_status_histogram_buckets directive.
- counters
- The cumulative values for the reason that each bucket value is greater than or equal to the only upstream response processing time.
- weight
- Current
weight setting of the server.
- maxFails
- Current
max_fails setting of the server.
- failTimeout
- Current
fail_timeout setting of the server.
- backup
- Current
backup setting of the server.
- down
- Current
down setting of the server. Basically, this is just a mark the ngx_http_upstream_module's server down(eg. server backend3.example.com down), not actual upstream server state. It will changed to actual state if you enabled the upstream zone directive.
- cacheZones
- maxSize
- The limit on the maximum size of the cache specified in the configuration.
- usedSize
- The current size of the cache.
- inBytes
- The total number of bytes received from the cache.
- outBytes
- The total number of bytes sent from the cache.
- responses
- miss
- The number of cache miss.
- bypass
- The number of cache bypass.
- expired
- The number of cache expired.
- stale
- The number of cache stale.
- updating
- The number of cache updating.
- revalidated
- The number of cache revalidated.
- hit
- The number of cache hit.
- scarce
- The number of cache scare.
/{status_uri}/format/json
/{status_uri}/control?cmd=status&...
- hostName
- Host name.
- nginxVersion
- Version of the provided.
- loadMsec
- Loaded process time in milliseconds.
- nowMsec
- Current time in milliseconds
- connections
- active
- The current number of active client connections.
- reading
- The total number of reading client connections.
- writing
- The total number of writing client connections.
- waiting
- The total number of wating client connections.
- accepted
- The total number of accepted client connections.
- handled
- The total number of handled client connections.
- requests
- The total number of requested client connections.
- active
- sharedZones
- name
- The name of shared memory specified in the configuration.(default:
vhost_traffic_status)
- The name of shared memory specified in the configuration.(default:
- maxSize
- The limit on the maximum size of the shared memory specified in the configuration.
- usedSize
- The current size of the shared memory.
- usedNode
- The current number of node using in shared memory. It can get an approximate size for one node with the following formula: (usedSize / usedNode)
- name
- serverZones
- requestCounter
- The total number of client requests received from clients.
- inBytes
- The total number of bytes received from clients.
- outBytes
- The total number of bytes sent to clients.
- responses
- 1xx, 2xx, 3xx, 4xx, 5xx
- The number of responses with status codes 1xx, 2xx, 3xx, 4xx, and 5xx.
- miss
- The number of cache miss.
- bypass
- The number of cache bypass.
- expired
- The number of cache expired.
- stale
- The number of cache stale.
- updating
- The number of cache updating.
- revalidated
- The number of cache revalidated.
- hit
- The number of cache hit.
- scarce
- The number of cache scare.
- 1xx, 2xx, 3xx, 4xx, 5xx
- requestMsecCounter
- The number of accumulated request processing time in milliseconds.
- requestMsec
- The average of request processing times in milliseconds.
- requestMsecs
- times
- The times in milliseconds at request processing times.
- msecs
- The request processing times in milliseconds.
- times
- requestBuckets
- msecs
- The bucket values of histogram set by
vhost_traffic_status_histogram_bucketsdirective.
- The bucket values of histogram set by
- counters
- The cumulative values for the reason that each bucket value is greater than or equal to the request processing time.
- msecs
- requestCounter
- filterZones
- It provides the same fields with
serverZonesexcept that it included group names.
- It provides the same fields with
- upstreamZones
- server
- An address of the server.
- requestCounter
- The total number of client connections forwarded to this server.
- inBytes
- The total number of bytes received from this server.
- outBytes
- The total number of bytes sent to this server.
- responses
- 1xx, 2xx, 3xx, 4xx, 5xx
- The number of responses with status codes 1xx, 2xx, 3xx, 4xx, and 5xx.
- 1xx, 2xx, 3xx, 4xx, 5xx
- requestMsecCounter
- The number of accumulated request processing time including upstream in milliseconds.
- requestMsec
- The average of request processing times including upstream in milliseconds.
- requestMsecs
- times
- The times in milliseconds at request processing times.
- msecs
- The request processing times including upstream in milliseconds.
- times
- requestBuckets
- msecs
- The bucket values of histogram set by
vhost_traffic_status_histogram_bucketsdirective.
- The bucket values of histogram set by
- counters
- The cumulative values for the reason that each bucket value is greater than or equal to the request processing time including upstream.
- msecs
- responseMsecCounter
- The number of accumulated only upstream response processing time in milliseconds.
- responseMsec
- The average of only upstream response processing times in milliseconds.
- responseMsecs
- times
- The times in milliseconds at request processing times.
- msecs
- The only upstream response processing times in milliseconds.
- times
- responseBuckets
- msecs
- The bucket values of histogram set by
vhost_traffic_status_histogram_bucketsdirective.
- The bucket values of histogram set by
- counters
- The cumulative values for the reason that each bucket value is greater than or equal to the only upstream response processing time.
- msecs
- weight
- Current
weightsetting of the server.
- Current
- maxFails
- Current
max_failssetting of the server.
- Current
- failTimeout
- Current
fail_timeoutsetting of the server.
- Current
- backup
- Current
backupsetting of the server.
- Current
- down
- Current
downsetting of the server. Basically, this is just a mark the ngx_http_upstream_module's server down(eg.server backend3.example.com down), not actual upstream server state. It will changed to actual state if you enabled the upstream zone directive.
- Current
- server
- cacheZones
- maxSize
- The limit on the maximum size of the cache specified in the configuration.
- usedSize
- The current size of the cache.
- inBytes
- The total number of bytes received from the cache.
- outBytes
- The total number of bytes sent from the cache.
- responses
- miss
- The number of cache miss.
- bypass
- The number of cache bypass.
- expired
- The number of cache expired.
- stale
- The number of cache stale.
- updating
- The number of cache updating.
- revalidated
- The number of cache revalidated.
- hit
- The number of cache hit.
- scarce
- The number of cache scare.
- miss
- maxSize
Json used by control
/{status_uri}/control?cmd=reset&...
/{status_uri}/control?cmd=delete&...
- processingReturn
- The result of true or false.
- processingCommandString
- The requested command string.
- processingGroupString
- The requested group string.
- processingZoneString
- The requested zone string.
- processingCounts
- The actual processing number.
Variables
The following embedded variables are provided:
- $vts_request_counter
- The total number of client requests received from clients.
- $vts_in_bytes
- The total number of bytes received from clients.
- $vts_out_bytes
- The total number of bytes sent to clients.
- $vts_1xx_counter
- The number of responses with status codes 1xx.
- $vts_2xx_counter
- The number of responses with status codes 2xx.
- $vts_3xx_counter
- The number of responses with status codes 3xx.
- $vts_4xx_counter
- The number of responses with status codes 4xx.
- $vts_5xx_counter
- The number of responses with status codes 5xx.
- $vts_cache_miss_counter
- The number of cache miss.
- $vts_cache_bypass_counter
- The number of cache bypass.
- $vts_cache_expired_counter
- The number of cache expired.
- $vts_cache_stale_counter
- The number of cache stale.
- $vts_cache_updating_counter
- The number of cache updating.
- $vts_cache_revalidated_counter
- The number of cache revalidated.
- $vts_cache_hit_counter
- The number of cache hit.
- $vts_cache_scarce_counter
- The number of cache scare.
- $vts_request_time_counter
- The number of accumulated request processing time.
- $vts_request_time
- The average of request processing times.
Limit
It is able to limit total traffic per each host by using the directive vhost_traffic_status_limit_traffic. It also is able to limit all traffic by using the directive vhost_traffic_status_limit_traffic_by_set_key. When the limit is exceeded, the server will return the 503 (Service Temporarily Unavailable) error in reply to a request. The return code can be changeable.
It is able to limit total traffic per each host by using the directive vhost_traffic_status_limit_traffic. It also is able to limit all traffic by using the directive vhost_traffic_status_limit_traffic_by_set_key. When the limit is exceeded, the server will return the 503 (Service Temporarily Unavailable) error in reply to a request. The return code can be changeable.
To limit traffic for server
http {

    vhost_traffic_status_zone;

    ...

    server {

        server_name *.example.org;

        vhost_traffic_status_limit_traffic in:64G;
        vhost_traffic_status_limit_traffic out:1024G;

        ...
    }
}
- Limit in/out total traffic on the
*.example.org to 64G and 1024G respectively. It works individually per each domain if vhost_traffic_status_filter_by_host directive is enabled.
http { vhost_traffic_status_zone; ... server { server_name *.example.org; vhost_traffic_status_limit_traffic in:64G; vhost_traffic_status_limit_traffic out:1024G; ... } }
- Limit in/out total traffic on the
*.example.orgto 64G and 1024G respectively. It works individually per each domain ifvhost_traffic_status_filter_by_hostdirective is enabled.
To limit traffic for filter
http {
    geoip_country /usr/share/GeoIP/GeoIP.dat;

    vhost_traffic_status_zone;

    ...

    server {

        server_name example.org;

        vhost_traffic_status_filter_by_set_key $geoip_country_code country::$server_name;
        vhost_traffic_status_limit_traffic_by_set_key FG@country::$server_name@US out:1024G;
        vhost_traffic_status_limit_traffic_by_set_key FG@country::$server_name@CN out:2048G;

        ...

    }
}
- Limit total traffic of going into US and CN on the
example.org to 1024G and 2048G respectively.
http { geoip_country /usr/share/GeoIP/GeoIP.dat; vhost_traffic_status_zone; ... server { server_name example.org; vhost_traffic_status_filter_by_set_key $geoip_country_code country::$server_name; vhost_traffic_status_limit_traffic_by_set_key FG@country::$server_name@US out:1024G; vhost_traffic_status_limit_traffic_by_set_key FG@country::$server_name@CN out:2048G; ... } }
- Limit total traffic of going into US and CN on the
example.orgto 1024G and 2048G respectively.
To limit traffic for upstream
http {

    vhost_traffic_status_zone;

    ...

    upstream backend {
        server 10.10.10.17:80;
        server 10.10.10.18:80;
    }

    server {

        server_name example.org;

        location /backend {
            vhost_traffic_status_limit_traffic_by_set_key UG@backend@10.10.10.17:80 in:512G;
            vhost_traffic_status_limit_traffic_by_set_key UG@backend@10.10.10.18:80 in:1024G;
            proxy_pass http://backend;
        }

        ...

    }
}
- Limit total traffic of going into upstream backend on the
example.org to 512G and 1024G per each peer.
Caveats: Traffic is the cumulative transfer or counter, not a bandwidth.
http { vhost_traffic_status_zone; ... upstream backend { server 10.10.10.17:80; server 10.10.10.18:80; } server { server_name example.org; location /backend { vhost_traffic_status_limit_traffic_by_set_key UG@backend@10.10.10.17:80 in:512G; vhost_traffic_status_limit_traffic_by_set_key UG@backend@10.10.10.18:80 in:1024G; proxy_pass http://backend; } ... } }
- Limit total traffic of going into upstream backend on the
example.orgto 512G and 1024G per each peer.
Caveats: Traffic is the cumulative transfer or counter, not a bandwidth.
Use cases
It is able to calculate the user defined individual stats by using the directive vhost_traffic_status_filter_by_set_key.
It is able to calculate the user defined individual stats by using the directive vhost_traffic_status_filter_by_set_key.
To calculate traffic for individual country using GeoIP
http {
    geoip_country /usr/share/GeoIP/GeoIP.dat;

    vhost_traffic_status_zone;
    vhost_traffic_status_filter_by_set_key $geoip_country_code country::*;

    ...

    server {

        ...

        vhost_traffic_status_filter_by_set_key $geoip_country_code country::$server_name;

        location /status {
            vhost_traffic_status_display;
            vhost_traffic_status_display_format html;
        }
    }
}
- Calculate traffic for individual country of total server groups.
- Calculate traffic for individual country of each server groups.
Basically, country flags image is built-in in HTML. The country flags image is enabled if the country string is included in group name which is second argument of vhost_traffic_status_filter_by_set_key directive.
http { geoip_country /usr/share/GeoIP/GeoIP.dat; vhost_traffic_status_zone; vhost_traffic_status_filter_by_set_key $geoip_country_code country::*; ... server { ... vhost_traffic_status_filter_by_set_key $geoip_country_code country::$server_name; location /status { vhost_traffic_status_display; vhost_traffic_status_display_format html; } } }
- Calculate traffic for individual country of total server groups.
- Calculate traffic for individual country of each server groups.
Basically, country flags image is built-in in HTML. The country flags image is enabled if the country string is included in group name which is second argument of vhost_traffic_status_filter_by_set_key directive.
To calculate traffic for individual storage volume
http {
    vhost_traffic_status_zone;

    ...

    server {

        ...

        location ~ ^/storage/(.+)/.*$ {
            set $volume $1;
            vhost_traffic_status_filter_by_set_key $volume storage::$server_name;
        }

        location /status {
            vhost_traffic_status_display;
            vhost_traffic_status_display_format html;
        }
    }
}
- Calculate traffic for individual storage volume matched by regular expression of location directive.
http { vhost_traffic_status_zone; ... server { ... location ~ ^/storage/(.+)/.*$ { set $volume $1; vhost_traffic_status_filter_by_set_key $volume storage::$server_name; } location /status { vhost_traffic_status_display; vhost_traffic_status_display_format html; } } }
- Calculate traffic for individual storage volume matched by regular expression of location directive.
To calculate traffic for individual user agent
http {
    vhost_traffic_status_zone;

    map $http_user_agent $filter_user_agent {
        default 'unknown';
        ~iPhone ios;
        ~Android android;
        ~(MSIE|Mozilla) windows;
    }

    vhost_traffic_status_filter_by_set_key $filter_user_agent agent::*;

    ...

    server {

        ...

        vhost_traffic_status_filter_by_set_key $filter_user_agent agent::$server_name;

        location /status {
            vhost_traffic_status_display;
            vhost_traffic_status_display_format html;
        }
    }
}
- Calculate traffic for individual
http_user_agent
http { vhost_traffic_status_zone; map $http_user_agent $filter_user_agent { default 'unknown'; ~iPhone ios; ~Android android; ~(MSIE|Mozilla) windows; } vhost_traffic_status_filter_by_set_key $filter_user_agent agent::*; ... server { ... vhost_traffic_status_filter_by_set_key $filter_user_agent agent::$server_name; location /status { vhost_traffic_status_display; vhost_traffic_status_display_format html; } } }
- Calculate traffic for individual
http_user_agent
To calculate traffic for detailed http status code
http {
    vhost_traffic_status_zone;

    server {

        ...

        vhost_traffic_status_filter_by_set_key $status $server_name;

        location /status {
            vhost_traffic_status_display;
            vhost_traffic_status_display_format html;
        }
    }
}
- Calculate traffic for detailed
http status code
Caveats: $status variable is available in nginx-(1.3.2, 1.2.2).
http { vhost_traffic_status_zone; server { ... vhost_traffic_status_filter_by_set_key $status $server_name; location /status { vhost_traffic_status_display; vhost_traffic_status_display_format html; } } }
- Calculate traffic for detailed
http status code
Caveats: $status variable is available in nginx-(1.3.2, 1.2.2).
To calculate traffic for dynamic dns
If the domain has multiple DNS A records, you can calculate traffic for individual IPs for the domain using the filter feature or a variable in proxy_pass.
http {
    vhost_traffic_status_zone;

    upstream backend {
        elb.example.org:80;
    }

    ...

    server {

        ...

        location /backend {
            vhost_traffic_status_filter_by_set_key $upstream_addr upstream::backend;
            proxy_pass backend;
        }
    }
}
- Calculate traffic for individual IPs for the domain
elb.example.org. If elb.example.org has multiple DNS A records, will be display all IPs in filterZones. In the above settings, as NGINX starts up or reloads it configuration, it queries a DNS server to resolve domain and DNS A records is cached in memory. Therefore the DNS A records are not changed in memory even if DNS A records are chagned by DNS administrator unless NGINX re-starts up or reloads.
http {
    vhost_traffic_status_zone;

    resolver 10.10.10.53 valid=10s

    ...

    server {

        ...

        location /backend {
            set $backend_server elb.example.org;
            proxy_pass http://$backend_server;
        }
    }
}
- Calculate traffic for individual IPs for the domain
elb.example.org. If elb.example.org's DNS A record is changed, will be display both the old IP and the new IP in ::nogroups. Unlike the first upstream group setting, the second setting works well even if DNS A records are chagned by DNS administrator.
Caveats: Please more details about NGINX DNS see the dns-service-discovery-nginx-plus.
If the domain has multiple DNS A records, you can calculate traffic for individual IPs for the domain using the filter feature or a variable in proxy_pass.
http { vhost_traffic_status_zone; upstream backend { elb.example.org:80; } ... server { ... location /backend { vhost_traffic_status_filter_by_set_key $upstream_addr upstream::backend; proxy_pass backend; } } }
- Calculate traffic for individual IPs for the domain
elb.example.org. Ifelb.example.orghas multiple DNS A records, will be display all IPs infilterZones. In the above settings, as NGINX starts up or reloads it configuration, it queries a DNS server to resolve domain and DNS A records is cached in memory. Therefore the DNS A records are not changed in memory even if DNS A records are chagned by DNS administrator unless NGINX re-starts up or reloads.
http { vhost_traffic_status_zone; resolver 10.10.10.53 valid=10s ... server { ... location /backend { set $backend_server elb.example.org; proxy_pass http://$backend_server; } } }
- Calculate traffic for individual IPs for the domain
elb.example.org. Ifelb.example.org's DNS A record is changed, will be display both the old IP and the new IP in::nogroups. Unlike the first upstream group setting, the second setting works well even if DNS A records are chagned by DNS administrator.
Caveats: Please more details about NGINX DNS see the dns-service-discovery-nginx-plus.
To calculate traffic except for status page
http {
    vhost_traffic_status_zone;

    ...

    server {

        ...

        location /status {
            vhost_traffic_status_bypass_limit on;
            vhost_traffic_status_bypass_stats on;
            vhost_traffic_status_display;
            vhost_traffic_status_display_format html;
        }
    }
}
- The
/status uri is excluded from the status traffic calculation and limit feature. See the following directives:
http { vhost_traffic_status_zone; ... server { ... location /status { vhost_traffic_status_bypass_limit on; vhost_traffic_status_bypass_stats on; vhost_traffic_status_display; vhost_traffic_status_display_format html; } } }
- The
/statusuri is excluded from the status traffic calculation and limit feature. See the following directives:
To maintain statistics data permanently
http {
    vhost_traffic_status_zone;
    vhost_traffic_status_dump /var/log/nginx/vts.db;

    ...

    server {

        ...

    }
}
- The
vhost_traffic_status_dump directive maintains statistics data permanently even if system has been rebooted or nginx has been restarted. Please see the vhost_traffic_status_dump directive for detailed usage.
http { vhost_traffic_status_zone; vhost_traffic_status_dump /var/log/nginx/vts.db; ... server { ... } }
- The
vhost_traffic_status_dumpdirective maintains statistics data permanently even if system has been rebooted or nginx has been restarted. Please see the vhost_traffic_status_dump directive for detailed usage.
Customizing
To customize after the module installed
- You need to change the
{{uri}} string to your status uri in status.template.html as follows:
shell> vi share/status.template.html
var vtsStatusURI = "yourStatusUri/format/json", vtsUpdateInterval = 1000;
- And then, customizing and copy status.template.html to server root directory as follows:
shell> cp share/status.template.html /usr/share/nginx/html/status.html
- Configure
nginx.conf
   server {
       server_name example.org;
       root /usr/share/nginx/html;

       # Redirect requests for / to /status.html
       location = / {
           return 301 /status.html;
       }

       location = /status.html {}

       # Everything beginning /status (except for /status.html) is
       # processed by the status handler
       location /status {
           vhost_traffic_status_display;
           vhost_traffic_status_display_format json;
       }
   }
- Access to your html.
http://example.org/status.html
- You need to change the
{{uri}}string to your status uri in status.template.html as follows:
shell> vi share/status.template.html
var vtsStatusURI = "yourStatusUri/format/json", vtsUpdateInterval = 1000;
- And then, customizing and copy status.template.html to server root directory as follows:
shell> cp share/status.template.html /usr/share/nginx/html/status.html
- Configure
nginx.conf
server { server_name example.org; root /usr/share/nginx/html; # Redirect requests for / to /status.html location = / { return 301 /status.html; } location = /status.html {} # Everything beginning /status (except for /status.html) is # processed by the status handler location /status { vhost_traffic_status_display; vhost_traffic_status_display_format json; } }
- Access to your html.
http://example.org/status.html
To customize before the module installed
Modify share/status.template.html (Do not change {{uri}} string)
Recreate the ngx_http_vhost_traffic_status_module_html.h as follows:
shell> cd util
shell> ./tplToDefine.sh ../share/status.template.html > ../src/ngx_http_vhost_traffic_status_module_html.h
Add the module to the build configuration by adding --add-module=/path/to/nginx-module-vts
Build the nginx binary.
Install the nginx binary.
Modify
share/status.template.html(Do not change{{uri}}string)Recreate the
ngx_http_vhost_traffic_status_module_html.has follows:
shell> cd util
shell> ./tplToDefine.sh ../share/status.template.html > ../src/ngx_http_vhost_traffic_status_module_html.h
Add the module to the build configuration by adding
--add-module=/path/to/nginx-module-vtsBuild the nginx binary.
Install the nginx binary.
Directives

vhost_traffic_status
- - Syntax vhost_traffic_status <on|off> Default off Context http, server, location
Description: Enables or disables the module working. If you set vhost_traffic_status_zone directive, is automatically enabled.
| - | - |
|---|---|
| Syntax | vhost_traffic_status <on|off> |
| Default | off |
| Context | http, server, location |
Description: Enables or disables the module working. If you set vhost_traffic_status_zone directive, is automatically enabled.
vhost_traffic_status_zone
- - Syntax vhost_traffic_status_zone [shared:name:size] Default shared:vhost_traffic_status:1m Context http
Description: Sets parameters for a shared memory zone that will keep states for various keys. The cache is shared between all worker processes. In most cases, the shared memory size used by nginx-module-vts does not increase much. The shared memory size is increased pretty when using vhost_traffic_status_filter_by_set_key directive but if filter's keys are fixed(eg. the total number of the country code is about 240) it does not continuously increase.
If you use vhost_traffic_status_filter_by_set_key directive, set it as follows:
- Set to more than 32M shared memory size by default. (
vhost_traffic_status_zone shared:vhost_traffic_status:32m) - If the message(
"ngx_slab_alloc() failed: no memory in vhost_traffic_status_zone") printed in error_log, increase to more than (usedSize * 2).
| - | - |
|---|---|
| Syntax | vhost_traffic_status_zone [shared:name:size] |
| Default | shared:vhost_traffic_status:1m |
| Context | http |
Description: Sets parameters for a shared memory zone that will keep states for various keys. The cache is shared between all worker processes. In most cases, the shared memory size used by nginx-module-vts does not increase much. The shared memory size is increased pretty when using vhost_traffic_status_filter_by_set_key directive but if filter's keys are fixed(eg. the total number of the country code is about 240) it does not continuously increase.
If you use vhost_traffic_status_filter_by_set_key directive, set it as follows:
- Set to more than 32M shared memory size by default. (
vhost_traffic_status_zone shared:vhost_traffic_status:32m) - If the message(
"ngx_slab_alloc() failed: no memory in vhost_traffic_status_zone") printed in error_log, increase to more than (usedSize * 2).
vhost_traffic_status_dump
- - Syntax vhost_traffic_status_dump path [period] Default - Context http
Description: Enables the statistics data dump and restore. The path is a location to dump the statistics data.(e.g. /var/log/nginx/vts.db) The period is a backup cycle time.(Default: 60s) It is backed up immediately regardless of the backup cycle if nginx is exited by signal(SIGKILL).
| - | - |
|---|---|
| Syntax | vhost_traffic_status_dump path [period] |
| Default | - |
| Context | http |
Description: Enables the statistics data dump and restore. The path is a location to dump the statistics data.(e.g. /var/log/nginx/vts.db) The period is a backup cycle time.(Default: 60s) It is backed up immediately regardless of the backup cycle if nginx is exited by signal(SIGKILL).
vhost_traffic_status_display
- - Syntax vhost_traffic_status_display Default - Context http, server, location
Description: Enables or disables the module display handler.
| - | - |
|---|---|
| Syntax | vhost_traffic_status_display |
| Default | - |
| Context | http, server, location |
Description: Enables or disables the module display handler.
vhost_traffic_status_display_format
- - Syntax vhost_traffic_status_display_format <json|html|jsonp|prometheus> Default json Context http, server, location
Description: Sets the display handler's output format. If you set json, will respond with a JSON document. If you set html, will respond with the built-in live dashboard in HTML. If you set jsonp, will respond with a JSONP callback function(default: ngx_http_vhost_traffic_status_jsonp_callback). If you set prometheus, will respond with a prometheus document.
| - | - |
|---|---|
| Syntax | vhost_traffic_status_display_format <json|html|jsonp|prometheus> |
| Default | json |
| Context | http, server, location |
Description: Sets the display handler's output format. If you set json, will respond with a JSON document. If you set html, will respond with the built-in live dashboard in HTML. If you set jsonp, will respond with a JSONP callback function(default: ngx_http_vhost_traffic_status_jsonp_callback). If you set prometheus, will respond with a prometheus document.
vhost_traffic_status_display_jsonp
- - Syntax vhost_traffic_status_display_jsonp callback Default ngx_http_vhost_traffic_status_jsonp_callback Context http, server, location
Description: Sets the callback name for the JSONP.
| - | - |
|---|---|
| Syntax | vhost_traffic_status_display_jsonp callback |
| Default | ngx_http_vhost_traffic_status_jsonp_callback |
| Context | http, server, location |
Description: Sets the callback name for the JSONP.
vhost_traffic_status_display_sum_key
- - Syntax vhost_traffic_status_display_sum_key name Default * Context http, server, location
Description: Sets the sum key string in serverZones field's JSON. The default sum key string is the "*".
| - | - |
|---|---|
| Syntax | vhost_traffic_status_display_sum_key name |
| Default | * |
| Context | http, server, location |
Description: Sets the sum key string in serverZones field's JSON. The default sum key string is the "*".
vhost_traffic_status_filter
- - Syntax vhost_traffic_status_filter <on|off> Default on Context http, server, location
Description: Enables or disables the filter features.
| - | - |
|---|---|
| Syntax | vhost_traffic_status_filter <on|off> |
| Default | on |
| Context | http, server, location |
Description: Enables or disables the filter features.
vhost_traffic_status_filter_by_host
- - Syntax vhost_traffic_status_filter_by_host <on|off> Default off Context http, server, location
Description: Enables or disables the keys by Host header field. If you set on and nginx's server_name directive set several or wildcard name starting with an asterisk, e.g. “*.example.org” and requested to server with hostname such as (a|b|c).example.org or *.example.org then json serverZones is printed as follows:
server {
  server_name *.example.org;
  vhost_traffic_status_filter_by_host on;

  ...

}
  ...
  "serverZones": {
      "a.example.org": {
      ...
      },
      "b.example.org": {
      ...
      },
      "c.example.org": {
      ...
      }
      ...
   },
   ...
It provides the same function that set vhost_traffic_status_filter_by_set_key $host.
| - | - |
|---|---|
| Syntax | vhost_traffic_status_filter_by_host <on|off> |
| Default | off |
| Context | http, server, location |
Description: Enables or disables the keys by Host header field. If you set on and nginx's server_name directive set several or wildcard name starting with an asterisk, e.g. “*.example.org” and requested to server with hostname such as (a|b|c).example.org or *.example.org then json serverZones is printed as follows:
server { server_name *.example.org; vhost_traffic_status_filter_by_host on; ... }
... "serverZones": { "a.example.org": { ... }, "b.example.org": { ... }, "c.example.org": { ... } ... }, ...
It provides the same function that set vhost_traffic_status_filter_by_set_key $host.
vhost_traffic_status_filter_by_set_key
- - Syntax vhost_traffic_status_filter_by_set_key key [name] Default - Context http, server, location
Description: Enables the keys by user defined variable. The key is a key string to calculate traffic. The name is a group string to calculate traffic. The key and name can contain variables such as $host, $server_name. The name's group belongs to filterZones if specified. The key's group belongs to serverZones if not specified second argument name. The example with geoip module is as follows:
server {
  server_name example.org;
  vhost_traffic_status_filter_by_set_key $geoip_country_code country::$server_name;

  ...

}
  ...
  "serverZones": {
  ...
  },
  "filterZones": {
      "country::example.org": {
          "KR": {
              "requestCounter":...,
              "inBytes":...,
              "outBytes":...,
              "responses":{
                  "1xx":...,
                  "2xx":...,
                  "3xx":...,
                  "4xx":...,
                  "5xx":...,
                  "miss":...,
                  "bypass":...,
                  "expired":...,
                  "stale":...,
                  "updating":...,
                  "revalidated":...,
                  "hit":...,
                  "scarce":...
              },
              "requestMsecCounter":...,
              "requestMsec":...,
              "requestMsecs":{
                  "times":[...],
                  "msecs":[...]
              },
          },
          "US": {
          ...
          },
          ...
      },
      ...
  },
  ...
| - | - |
|---|---|
| Syntax | vhost_traffic_status_filter_by_set_key key [name] |
| Default | - |
| Context | http, server, location |
Description: Enables the keys by user defined variable. The key is a key string to calculate traffic. The name is a group string to calculate traffic. The key and name can contain variables such as $host, $server_name. The name's group belongs to filterZones if specified. The key's group belongs to serverZones if not specified second argument name. The example with geoip module is as follows:
server { server_name example.org; vhost_traffic_status_filter_by_set_key $geoip_country_code country::$server_name; ... }
... "serverZones": { ... }, "filterZones": { "country::example.org": { "KR": { "requestCounter":..., "inBytes":..., "outBytes":..., "responses":{ "1xx":..., "2xx":..., "3xx":..., "4xx":..., "5xx":..., "miss":..., "bypass":..., "expired":..., "stale":..., "updating":..., "revalidated":..., "hit":..., "scarce":... }, "requestMsecCounter":..., "requestMsec":..., "requestMsecs":{ "times":[...], "msecs":[...] }, }, "US": { ... }, ... }, ... }, ...
vhost_traffic_status_filter_check_duplicate
- - Syntax vhost_traffic_status_filter_check_duplicate <on|off> Default on Context http, server, location
Description: Enables or disables the deduplication of vhost_traffic_status_filter_by_set_key. It is processed only one of duplicate values(key + name) in each directives(http, server, location) if this option is enabled.
| - | - |
|---|---|
| Syntax | vhost_traffic_status_filter_check_duplicate <on|off> |
| Default | on |
| Context | http, server, location |
Description: Enables or disables the deduplication of vhost_traffic_status_filter_by_set_key. It is processed only one of duplicate values(key + name) in each directives(http, server, location) if this option is enabled.
vhost_traffic_status_filter_max_node
- - Syntax vhost_traffic_status_filter_max_node number [string ...] Default 0 Context http
Description: Enables the limit of filter size using the specified number and string values. If the number is exceeded, the existing nodes are deleted by the LRU algorithm. The number argument is the size of the node that will be limited. The default value 0 does not limit filters. The one node is an object in filterZones in JSON document. The string arguments are the matching string values for the group string value set by vhost_traffic_status_filter_by_set_key directive. Even if only the first part matches, matching is successful like the regular expression /^string.*/. By default, If you do not set string arguments then it applied for all filters.
For examples:
$ vi nginx.conf
http {

    geoip_country /usr/share/GeoIP/GeoIP.dat;

    vhost_traffic_status_zone;

    # The all filters are limited to a total of 16 nodes.
    # vhost_traffic_status_filter_max_node 16

    # The `/^uris.*/` and `/^client::ports.*/` group string patterns are limited to a total of 64 nodes.
    vhost_traffic_status_filter_max_node 16 uris client::ports

    ...

    server {

        server_name example.org;

        ...

        vhost_traffic_status_filter_by_set_key $uri uris::$server_name;
        vhost_traffic_status_filter_by_set_key $remote_port client::ports::$server_name;
        vhost_traffic_status_filter_by_set_key $geoip_country_code country::$server_name;

    }
}
$ for i in {0..1000}; do curl -H 'Host: example.org' -i "http://localhost:80/test$i"; done
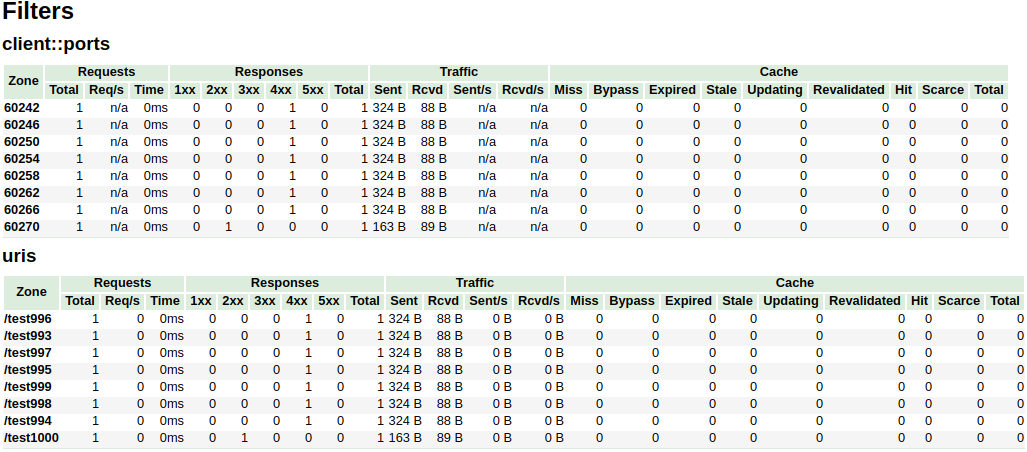
In the above example, the /^uris.*/ and /^client::ports.*/ group string patterns are limited to a total of 16 nodes. The other filters like country::.* are not limited.
| - | - |
|---|---|
| Syntax | vhost_traffic_status_filter_max_node number [string ...] |
| Default | 0 |
| Context | http |
Description: Enables the limit of filter size using the specified number and string values. If the number is exceeded, the existing nodes are deleted by the LRU algorithm. The number argument is the size of the node that will be limited. The default value 0 does not limit filters. The one node is an object in filterZones in JSON document. The string arguments are the matching string values for the group string value set by vhost_traffic_status_filter_by_set_key directive. Even if only the first part matches, matching is successful like the regular expression /^string.*/. By default, If you do not set string arguments then it applied for all filters.
For examples:
$ vi nginx.conf
http { geoip_country /usr/share/GeoIP/GeoIP.dat; vhost_traffic_status_zone; # The all filters are limited to a total of 16 nodes. # vhost_traffic_status_filter_max_node 16 # The `/^uris.*/` and `/^client::ports.*/` group string patterns are limited to a total of 64 nodes. vhost_traffic_status_filter_max_node 16 uris client::ports ... server { server_name example.org; ... vhost_traffic_status_filter_by_set_key $uri uris::$server_name; vhost_traffic_status_filter_by_set_key $remote_port client::ports::$server_name; vhost_traffic_status_filter_by_set_key $geoip_country_code country::$server_name; } }
$ for i in {0..1000}; do curl -H 'Host: example.org' -i "http://localhost:80/test$i"; done
In the above example, the /^uris.*/ and /^client::ports.*/ group string patterns are limited to a total of 16 nodes. The other filters like country::.* are not limited.
vhost_traffic_status_limit
- - Syntax vhost_traffic_status_limit <on|off> Default on Context http, server, location
Description: Enables or disables the limit features.
| - | - |
|---|---|
| Syntax | vhost_traffic_status_limit <on|off> |
| Default | on |
| Context | http, server, location |
Description: Enables or disables the limit features.
vhost_traffic_status_limit_traffic
- - Syntax vhost_traffic_status_limit_traffic member:size [code] Default - Context http, server, location
Description: Enables the traffic limit for specified member. The member is a member string to limit traffic. The size is a size(k/m/g) to limit traffic. The code is a code to return in response to rejected requests.(Default: 503)
The available member strings are as follows:
- request
- The total number of client requests received from clients.
- in
- The total number of bytes received from clients.
- out
- The total number of bytes sent to clients.
- 1xx
- The number of responses with status codes 1xx.
- 2xx
- The number of responses with status codes 2xx.
- 3xx
- The number of responses with status codes 3xx.
- 4xx
- The number of responses with status codes 4xx.
- 5xx
- The number of responses with status codes 5xx.
- cache_miss
- The number of cache miss.
- cache_bypass
- The number of cache bypass.
- cache_expired
- The number of cache expired.
- cache_stale
- The number of cache stale.
- cache_updating
- The number of cache updating.
- cache_revalidated
- The number of cache revalidated.
- cache_hit
- The number of cache hit.
- cache_scarce
- The number of cache scare.
| - | - |
|---|---|
| Syntax | vhost_traffic_status_limit_traffic member:size [code] |
| Default | - |
| Context | http, server, location |
Description: Enables the traffic limit for specified member. The member is a member string to limit traffic. The size is a size(k/m/g) to limit traffic. The code is a code to return in response to rejected requests.(Default: 503)
The available member strings are as follows:
- request
- The total number of client requests received from clients.
- in
- The total number of bytes received from clients.
- out
- The total number of bytes sent to clients.
- 1xx
- The number of responses with status codes 1xx.
- 2xx
- The number of responses with status codes 2xx.
- 3xx
- The number of responses with status codes 3xx.
- 4xx
- The number of responses with status codes 4xx.
- 5xx
- The number of responses with status codes 5xx.
- cache_miss
- The number of cache miss.
- cache_bypass
- The number of cache bypass.
- cache_expired
- The number of cache expired.
- cache_stale
- The number of cache stale.
- cache_updating
- The number of cache updating.
- cache_revalidated
- The number of cache revalidated.
- cache_hit
- The number of cache hit.
- cache_scarce
- The number of cache scare.
vhost_traffic_status_limit_traffic_by_set_key
- - Syntax vhost_traffic_status_limit_traffic_by_set_key key member:size [code] Default - Context http, server, location
Description: Enables the traffic limit for specified key and member. The key is a key string to limit traffic. The member is a member string to limit traffic. The size is a size(k/m/g) to limit traffic. The code is a code to return in response to rejected requests.(Default: 503)
The key syntax is as follows:
group@[subgroup@]name
The available group strings are as follows:
- NO
- The group of server.
- UA
- The group of upstream alone.
- UG
- The group of upstream group.(use
subgroup)
- CC
- The group of cache.
- FG
- The group of filter.(use
subgroup)
The available member strings are as follows:
- request
- The total number of client requests received from clients.
- in
- The total number of bytes received from clients.
- out
- The total number of bytes sent to clients.
- 1xx
- The number of responses with status codes 1xx.
- 2xx
- The number of responses with status codes 2xx.
- 3xx
- The number of responses with status codes 3xx.
- 4xx
- The number of responses with status codes 4xx.
- 5xx
- The number of responses with status codes 5xx.
- cache_miss
- The number of cache miss.
- cache_bypass
- The number of cache bypass.
- cache_expired
- The number of cache expired.
- cache_stale
- The number of cache stale.
- cache_updating
- The number of cache updating.
- cache_revalidated
- The number of cache revalidated.
- cache_hit
- The number of cache hit.
- cache_scarce
- The number of cache scare.
The member is the same as vhost_traffic_status_limit_traffic directive.
| - | - |
|---|---|
| Syntax | vhost_traffic_status_limit_traffic_by_set_key key member:size [code] |
| Default | - |
| Context | http, server, location |
Description: Enables the traffic limit for specified key and member. The key is a key string to limit traffic. The member is a member string to limit traffic. The size is a size(k/m/g) to limit traffic. The code is a code to return in response to rejected requests.(Default: 503)
The key syntax is as follows:
group@[subgroup@]name
The available group strings are as follows:
- NO
- The group of server.
- UA
- The group of upstream alone.
- UG
- The group of upstream group.(use
subgroup)
- The group of upstream group.(use
- CC
- The group of cache.
- FG
- The group of filter.(use
subgroup)
- The group of filter.(use
The available member strings are as follows:
- request
- The total number of client requests received from clients.
- in
- The total number of bytes received from clients.
- out
- The total number of bytes sent to clients.
- 1xx
- The number of responses with status codes 1xx.
- 2xx
- The number of responses with status codes 2xx.
- 3xx
- The number of responses with status codes 3xx.
- 4xx
- The number of responses with status codes 4xx.
- 5xx
- The number of responses with status codes 5xx.
- cache_miss
- The number of cache miss.
- cache_bypass
- The number of cache bypass.
- cache_expired
- The number of cache expired.
- cache_stale
- The number of cache stale.
- cache_updating
- The number of cache updating.
- cache_revalidated
- The number of cache revalidated.
- cache_hit
- The number of cache hit.
- cache_scarce
- The number of cache scare.
The member is the same as vhost_traffic_status_limit_traffic directive.
vhost_traffic_status_limit_check_duplicate
- - Syntax vhost_traffic_status_limit_check_duplicate <on|off> Default on Context http, server, location
Description: Enables or disables the deduplication of vhost_traffic_status_limit_by_set_key. It is processed only one of duplicate values(member | key + member) in each directives(http, server, location) if this option is enabled.
| - | - |
|---|---|
| Syntax | vhost_traffic_status_limit_check_duplicate <on|off> |
| Default | on |
| Context | http, server, location |
Description: Enables or disables the deduplication of vhost_traffic_status_limit_by_set_key. It is processed only one of duplicate values(member | key + member) in each directives(http, server, location) if this option is enabled.
vhost_traffic_status_set_by_filter
- - Syntax vhost_traffic_status_set_by_filter $variable group/zone/name Default - Context http, server, location, if
Description: Get the specified status value stored in shared memory. It can acquire almost all status values and the obtained value is stored in $variable which is first argument.
- group
- server
- filter
- upstream@alone
- upstream@group
- cache
- zone
- server
- name
- filter
- filter_group@name
- upstream@group
- upstream_group@name
- upstream@alone
- @name
- cache
- name
- name
- requestCounter
- The total number of client requests received from clients.
- requestMsecCounter
- The number of accumulated request processing time in milliseconds.
- requestMsec
- The average of request processing times in milliseconds.
- responseMsecCounter
- The number of accumulated only upstream response processing time in milliseconds.
- responseMsec
- The average of only upstream response processing times in milliseconds.
- inBytes
- The total number of bytes received from clients.
- outBytes
- The total number of bytes sent to clients.
- 1xx, 2xx, 3xx, 4xx, 5xx
- The number of responses with status codes 1xx, 2xx, 3xx, 4xx, and 5xx.
- cacheMaxSize
- The limit on the maximum size of the cache specified in the configuration.
- cacheUsedSize
- The current size of the cache.
- cacheMiss
- The number of cache miss.
- cacheBypass
- The number of cache bypass.
- cacheExpired
- The number of cache expired.
- cacheStale
- The number of cache stale.
- cacheUpdating
- The number of cache updating.
- cacheRevalidated
- The number of cache revalidated.
- cacheHit
- The number of cache hit.
- cacheScarce
- The number of cache scare.
- weight
- Current weight setting of the server.
- maxFails
- Current max_fails setting of the server.
- failTimeout
- Current fail_timeout setting of the server.
- backup
- Current backup setting of the server.(0|1)
- down
- Current down setting of the server.(0|1)
Caveats: The name is case sensitive. All return values take the integer type.
For examples:
- requestCounter in serverZones
- vhost_traffic_status_set_by_filter
$requestCounter server/example.org/requestCounter
- requestCounter in filterZones
- vhost_traffic_status_set_by_filter
$requestCounter filter/country::example.org@KR/requestCounter
- requestCounter in upstreamZones
- vhost_traffic_status_set_by_filter
$requestCounter upstream@group/backend@10.10.10.11:80/requestCounter
- requestCounter in upstreamZones::nogroups
- vhost_traffic_status_set_by_filter
$requestCounter upstream@alone/10.10.10.11:80/requestCounter
- cacheHit in cacheZones
- vhost_traffic_status_set_by_filter
$cacheHit cache/my_cache_name/cacheHit
| - | - |
|---|---|
| Syntax | vhost_traffic_status_set_by_filter $variable group/zone/name |
| Default | - |
| Context | http, server, location, if |
Description: Get the specified status value stored in shared memory. It can acquire almost all status values and the obtained value is stored in $variable which is first argument.
- group
- server
- filter
- upstream@alone
- upstream@group
- cache
- zone
- server
- name
- filter
- filter_group@name
- upstream@group
- upstream_group@name
- upstream@alone
- @name
- cache
- name
- server
- name
- requestCounter
- The total number of client requests received from clients.
- requestMsecCounter
- The number of accumulated request processing time in milliseconds.
- requestMsec
- The average of request processing times in milliseconds.
- responseMsecCounter
- The number of accumulated only upstream response processing time in milliseconds.
- responseMsec
- The average of only upstream response processing times in milliseconds.
- inBytes
- The total number of bytes received from clients.
- outBytes
- The total number of bytes sent to clients.
- 1xx, 2xx, 3xx, 4xx, 5xx
- The number of responses with status codes 1xx, 2xx, 3xx, 4xx, and 5xx.
- cacheMaxSize
- The limit on the maximum size of the cache specified in the configuration.
- cacheUsedSize
- The current size of the cache.
- cacheMiss
- The number of cache miss.
- cacheBypass
- The number of cache bypass.
- cacheExpired
- The number of cache expired.
- cacheStale
- The number of cache stale.
- cacheUpdating
- The number of cache updating.
- cacheRevalidated
- The number of cache revalidated.
- cacheHit
- The number of cache hit.
- cacheScarce
- The number of cache scare.
- weight
- Current weight setting of the server.
- maxFails
- Current max_fails setting of the server.
- failTimeout
- Current fail_timeout setting of the server.
- backup
- Current backup setting of the server.(0|1)
- down
- Current down setting of the server.(0|1)
- requestCounter
Caveats: The name is case sensitive. All return values take the integer type.
For examples:
- requestCounter in serverZones
- vhost_traffic_status_set_by_filter
$requestCounterserver/example.org/requestCounter
- vhost_traffic_status_set_by_filter
- requestCounter in filterZones
- vhost_traffic_status_set_by_filter
$requestCounterfilter/country::example.org@KR/requestCounter
- vhost_traffic_status_set_by_filter
- requestCounter in upstreamZones
- vhost_traffic_status_set_by_filter
$requestCounterupstream@group/backend@10.10.10.11:80/requestCounter
- vhost_traffic_status_set_by_filter
- requestCounter in upstreamZones::nogroups
- vhost_traffic_status_set_by_filter
$requestCounterupstream@alone/10.10.10.11:80/requestCounter
- vhost_traffic_status_set_by_filter
- cacheHit in cacheZones
- vhost_traffic_status_set_by_filter
$cacheHitcache/my_cache_name/cacheHit
- vhost_traffic_status_set_by_filter
vhost_traffic_status_average_method
- - Syntax vhost_traffic_status_average_method <AMM|WMA> [period] Default AMM 60s Context http, server, location
Description: Sets the method which is a formula that calculate the average of response processing times. The period is an effective time of the values used for the average calculation.(Default: 60s) If period set to 0, effective time is ignored. In this case, the last average value is displayed even if there is no requests and after the elapse of time. The corresponding values are requestMsec and responseMsec in JSON.
- AMM
- The AMM is the arithmetic mean.
- WMA
- THE WMA is the weighted moving average.
| - | - |
|---|---|
| Syntax | vhost_traffic_status_average_method <AMM|WMA> [period] |
| Default | AMM 60s |
| Context | http, server, location |
Description: Sets the method which is a formula that calculate the average of response processing times. The period is an effective time of the values used for the average calculation.(Default: 60s) If period set to 0, effective time is ignored. In this case, the last average value is displayed even if there is no requests and after the elapse of time. The corresponding values are requestMsec and responseMsec in JSON.
- AMM
- The AMM is the arithmetic mean.
- WMA
- THE WMA is the weighted moving average.
vhost_traffic_status_histogram_buckets
- - Syntax vhost_traffic_status_histogram_buckets second ... Default - Context http, server, location
Description: Sets the observe buckets to be used in the histograms. By default, if you do not set this directive, it will not work. The second can be expressed in decimal places with a minimum value of 0.001(1ms). The maximum size of the buckets is 32. If this value is insufficient for you, change the NGX_HTTP_VHOST_TRAFFIC_STATUS_DEFAULT_BUCKET_LEN in the src/ngx_http_vhost_traffic_status_node.h
For examples:
- vhost_traffic_status_histogram_buckets
0.005 0.01 0.05 0.1 0.5 1 5 10- The observe buckets are [5ms 10ms 50ms 1s 5s 10s].
- vhost_traffic_status_histogram_buckets
0.005 0.01 0.05 0.1- The observe buckets are [5ms 10ms 50ms 1s].
Caveats: By default, if you do not set this directive, the histogram statistics does not work. The restored histograms by vhost_traffic_status_dump directive have no affected by changes to the buckets by vhost_traffic_status_histogram_buckets directive. So you must first delete the zone or the dump file before changing the buckets by vhost_traffic_status_histogram_buckets directive. Similar to the above, delete the dump file when using the histogram for the first time.
| - | - |
|---|---|
| Syntax | vhost_traffic_status_histogram_buckets second ... |
| Default | - |
| Context | http, server, location |
Description: Sets the observe buckets to be used in the histograms. By default, if you do not set this directive, it will not work. The second can be expressed in decimal places with a minimum value of 0.001(1ms). The maximum size of the buckets is 32. If this value is insufficient for you, change the NGX_HTTP_VHOST_TRAFFIC_STATUS_DEFAULT_BUCKET_LEN in the src/ngx_http_vhost_traffic_status_node.h
For examples:
- vhost_traffic_status_histogram_buckets
0.0050.010.050.10.51510- The observe buckets are [5ms 10ms 50ms 1s 5s 10s].
- vhost_traffic_status_histogram_buckets
0.0050.010.050.1- The observe buckets are [5ms 10ms 50ms 1s].
Caveats: By default, if you do not set this directive, the histogram statistics does not work. The restored histograms by vhost_traffic_status_dump directive have no affected by changes to the buckets by vhost_traffic_status_histogram_buckets directive. So you must first delete the zone or the dump file before changing the buckets by vhost_traffic_status_histogram_buckets directive. Similar to the above, delete the dump file when using the histogram for the first time.
vhost_traffic_status_bypass_limit
- - Syntax vhost_traffic_status_bypass_limit <on|off> Default off Context http, server, location
Description: Enables or disables to bypass vhost_traffic_status_limit directives. The limit features is bypassed if this option is enabled. This is mostly useful if you want to connect the status web page like /status regardless of vhost_traffic_status_limit directives as follows:
http {
    vhost_traffic_status_zone;

    ...

    server {

        ...

        location /status {
            vhost_traffic_status_bypass_limit on;
            vhost_traffic_status_display;
            vhost_traffic_status_display_format html;
        }
    }
}
| - | - |
|---|---|
| Syntax | vhost_traffic_status_bypass_limit <on|off> |
| Default | off |
| Context | http, server, location |
Description: Enables or disables to bypass vhost_traffic_status_limit directives. The limit features is bypassed if this option is enabled. This is mostly useful if you want to connect the status web page like /status regardless of vhost_traffic_status_limit directives as follows:
http { vhost_traffic_status_zone; ... server { ... location /status { vhost_traffic_status_bypass_limit on; vhost_traffic_status_display; vhost_traffic_status_display_format html; } } }
vhost_traffic_status_bypass_stats
- - Syntax vhost_traffic_status_bypass_stats <on|off> Default off Context http, server, location
Description: Enables or disables to bypass vhost_traffic_status. The traffic status stats features is bypassed if this option is enabled. In other words, it is excluded from the traffic status stats. This is mostly useful if you want to ignore your request in status web page like /status as follows:
http {
    vhost_traffic_status_zone;

    ...

    server {

        ...

        location /status {
            vhost_traffic_status_bypass_stats on;
            vhost_traffic_status_display;
            vhost_traffic_status_display_format html;
        }
    }
}
| - | - |
|---|---|
| Syntax | vhost_traffic_status_bypass_stats <on|off> |
| Default | off |
| Context | http, server, location |
Description: Enables or disables to bypass vhost_traffic_status. The traffic status stats features is bypassed if this option is enabled. In other words, it is excluded from the traffic status stats. This is mostly useful if you want to ignore your request in status web page like /status as follows:
http { vhost_traffic_status_zone; ... server { ... location /status { vhost_traffic_status_bypass_stats on; vhost_traffic_status_display; vhost_traffic_status_display_format html; } } }
See Also
Stream traffic status
Prometheus
System protection
Stream traffic status
Prometheus
System protection
TODO
Donation

Author
YoungJoo.Kim(김영주) [vozltx@gmail.com]
YoungJoo.Kim(김영주) [vozltx@gmail.com]
 创作不易,留下一份鼓励
按点赞数排序
按时间排序


 微信公众号
微信公众号 加入微信群
加入微信群

